
Utilize your big data to build a smarter factory, and maintain breakthrough improvement.
Contact Us

Mahalanobis Taguchi system(MT system )is a highly efficient pattern recognition technology created by Dr. P.C. Mahalanobis and Dr. Genichi Taguchi, and it is being utilized for the same purpose of artificial intelligence (AI) across industries
as pattern recognition technologies play key role in the industry 4.0 and AI industry.
MT system is harnessing correlations between independent variables of a normal
group samples to classify, diagnose, and forecast patterns of unknown samples. MT system has widely been adopted in various
industries for decades and can be applied to almost all the context where we are using data for a decision. The typical applications are preventive
maintenance, production control, quality inspection, and detecting and locating root cause in manufacturing industry.

We provide consulting to solve problems with MT system on customer site or on line, and develop customized computing algorithms with R statistical analysis software to meet the purpose of the project.

MTシステムにおける技術開発 (品質工学応用講座), 田口 玄一, 日本規格協会, 2002
Quality Recognition and Prediction: Smarter Pattern Technology with the Mahalanobis-Taguchi System, Shoichi Teshima, Yoshiko Hasegawa, Kazuo Tatebayashi ,Momentum Press (New York), 2012.

MT-Runner helps MT system practitioners construct highly reliable unit space, and manage big data efficiently in response to the various conditions of data.


Product inspection and classification with big data created by machine and operator

Forecasting output (yield, strength, thickness, etc) of a manufacturing process with fewer samples

Detecting and locating defects with digital data on a fast production line

Machine, robot, facility condition monitoring with sensored data for preventive maintenance
Locating defects on an image with digitally transfered data

Evaluate and select important variables for classification, inspection , and forecasting.
| Algorithm | Application | Function | Output |
|---|---|---|---|
| MT |
|
Computing mahalanobis distance with correlation between variables |
|
| MTGS |
|
Computing mahalanobis distance with linearly independent vectors |
|
| EP |
|
Computing mahalanobis distance without inverse matrix |
|
| RT |
|
Computing mahalanobis distance with 2 reduced parameters |
|
| MTA |
|
Computing mahalanobis distance with an adjoint matrix |
|
| PCRT |
|
Computing mahalanobis distance with linearly independent principal components |
|
| T1 |
|
Forecasting outputs with a unit space and signal data |
|
Classifys unknown samples with higher accuracy after selecting important variables(X) for classification.
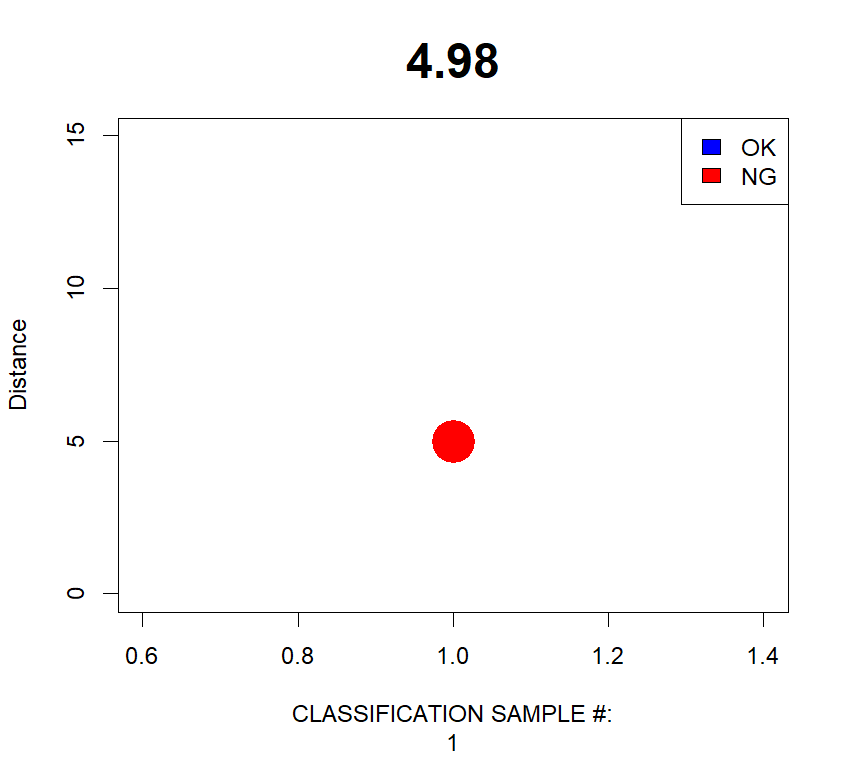
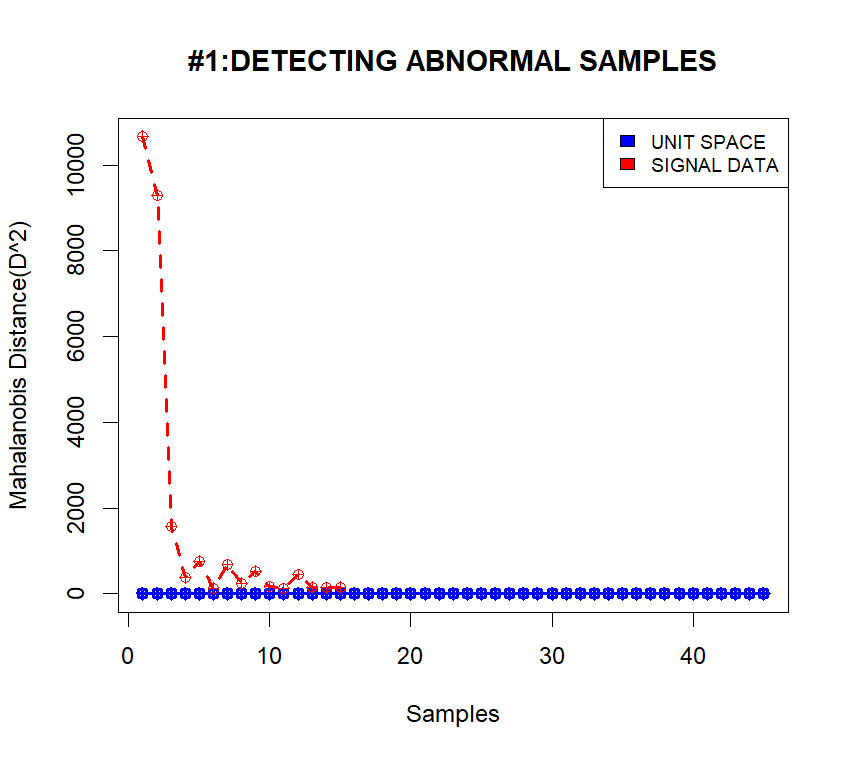
MT-Runner detects an abnormal wafer in the process of forming 21 thin coating layers on the surface of the wafer at deposition process.
A robot dropped a part while packing parts on line resulted in higher distances from the unit space.
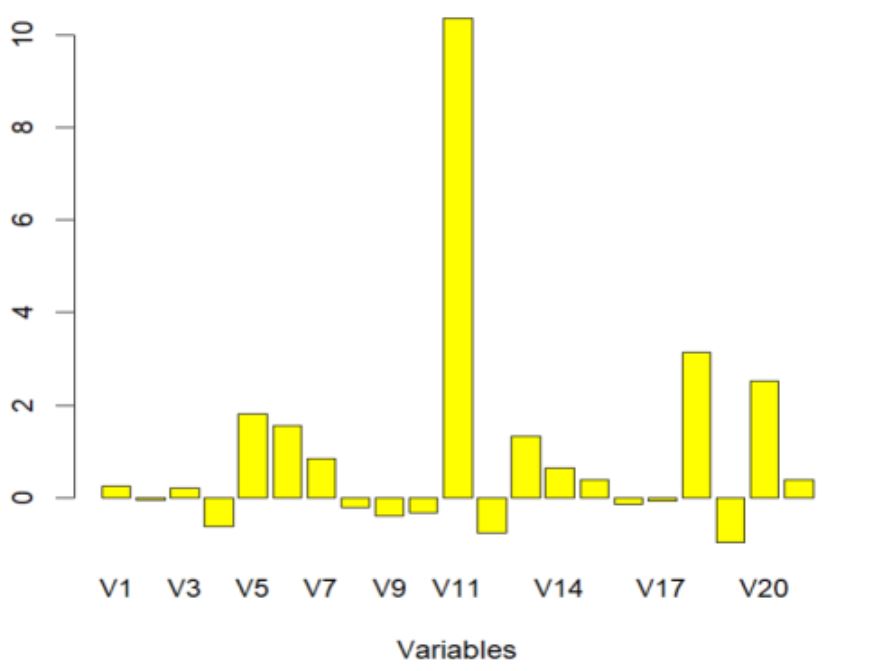
MT–Runner searches abnormal layers with pattern recognition algorithms and indicates variable #11 as a root cause of the defect.
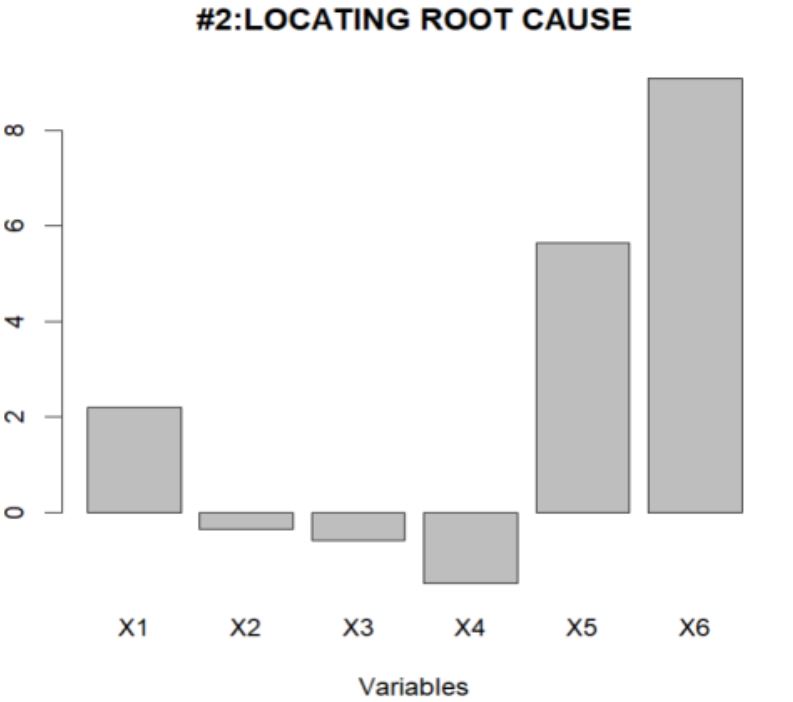
MT-Runner indicates variable X6 and X5 as the two critical root causes of the fail.
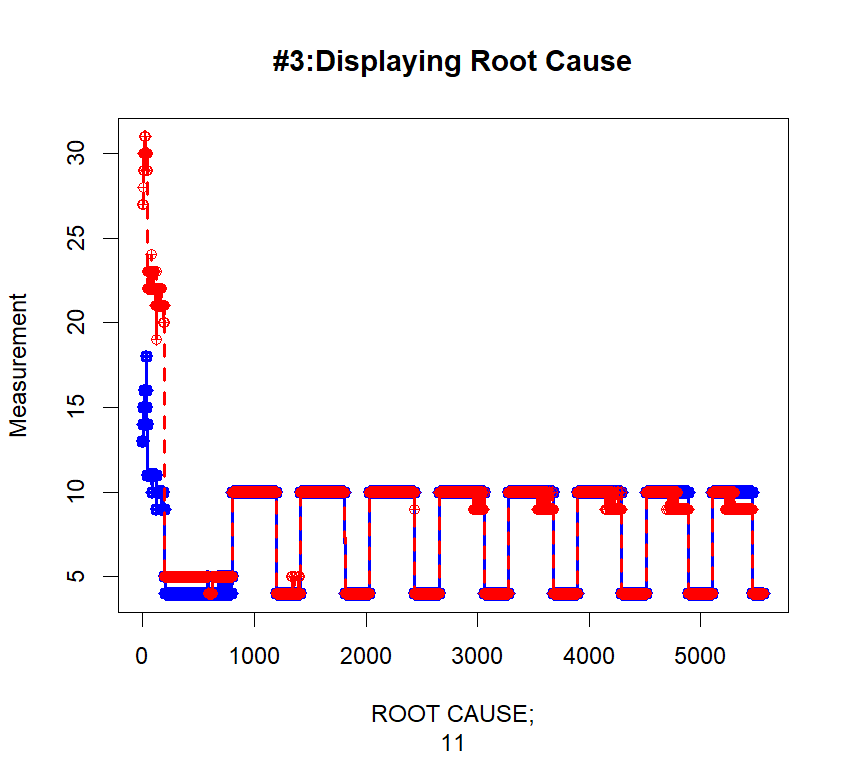
MT-Runner displays actual values of variable #11 to show how the root cause made defect.
MT-Runner displays actual values of variable X6 to show how the values differ from the normal.

The two most critical conditions in terms of time to complete a MT system project are time to prepare data and time to customize computing algorithms. In case of we can use well organized existing data saved with csv(comma-seperated value) format, it takes two or three weeks to choose suitable algorithms and to customize the algorithms for computing. However, when data are not available or if we should begin with defining and preparing normal samples to create data, It may take longer time for us to complete a project.
You can send us an email directly with clicking on above email address.


